Newcastle United currently sit 9th in the Premier League having accumulated 37 points from their first 26 games.
How does this compare to previous seasons?
| Points | Position | |
| 95/96 | 60 | 1 |
| 96/97 | 48 | 3 |
| 97/98 | 33 | 14 |
| 98/99 | 34 | 10 |
| 99/00 | 34 | 12 |
| 00/01 | 37 | 10 |
| 01/02 | 55 | 2 |
| 02/03 | 49 | 3 |
| 03/04 | 41 | 4 |
| 04/05 | 31 | 12 |
| 05/06 | 33 | 13 |
| 06/07 | 33 | 10 |
| 07/08 | 28 | 13 |
| 08/09 | 28 | 14 |
| 10/11 | 32 | 10 |
| 11/12 | 43 | 6 |
| 12/13 | 27 | 16 |
| 13/14 | 37 | 9 |
| Average | 38 | 9 |
The table below puts each season in order of points gained after 26 games:
| Seasons In Points Order | ||
| Points | Position | |
| 95/96 | 60 | 1 |
| 01/02 | 55 | 2 |
| 02/03 | 49 | 3 |
| 96/97 | 48 | 3 |
| 11/12 | 43 | 6 |
| 03/04 | 41 | 4 |
| 00/01 | 37 | 10 |
| 98/99 | 34 | 10 |
| 99/00 | 34 | 12 |
| 97/98 | 33 | 14 |
| 05/06 | 33 | 13 |
| 06/07 | 33 | 10 |
| 10/11 | 32 | 10 |
| 04/05 | 31 | 12 |
| 07/08 | 28 | 13 |
| 08/09 | 28 | 14 |
| 12/13 | 27 | 16 |
The average total of points after 26 games is 38.
The average position after 26 games is 9th.
The 2013/14 season is the 7th best after 26 games for points and position since the Premier League turned to the 20 team format.
The table below shows the league position after 26 games and 38 games:
| 26 Games | 38 Games | |
| 95/96 | 1 | 2 |
| 96/97 | 3 | 2 |
| 97/98 | 14 | 13 |
| 98/99 | 10 | 13 |
| 99/00 | 12 | 11 |
| 00/01 | 10 | 11 |
| 01/02 | 2 | 4 |
| 02/03 | 3 | 3 |
| 03/04 | 4 | 5 |
| 04/05 | 12 | 14 |
| 05/06 | 13 | 7 |
| 06/07 | 10 | 13 |
| 07/08 | 13 | 12 |
| 08/09 | 14 | 18 |
| 10/11 | 10 | 12 |
| 11/12 | 6 | 5 |
| 12/13 | 16 | 16 |
| 13/14 | ||
| Average | 9.0 | 9.5 |
The graph below shows the change in league position between the 26th and 38th game:

Position Change Between 26th and 38th Games
Europa League prize money:

A side could receive, at best, £8.2m from playing in this season’s competition (2013/14).
Premier League prize money:

Financial difference between 16th and 8th is £9,014,000 on the Merit Payment alone.
The Europa League run that Newcastle United went on covered their Merit Payment losses from the following season when they finished 16th.
If the FA increased the prize money for the FA Cup would managers/chairmen take the competition more seriously?
The prize money for the FA Cup 2013/14 is set out below:

Prize Money Run Total:
5th round – £337,500
6th round – £697,500
Semi-Final Loser – £1,147,500
Semi-Final Winner – £1,597,500
The estimated financial return for each Premier League position is set out below:
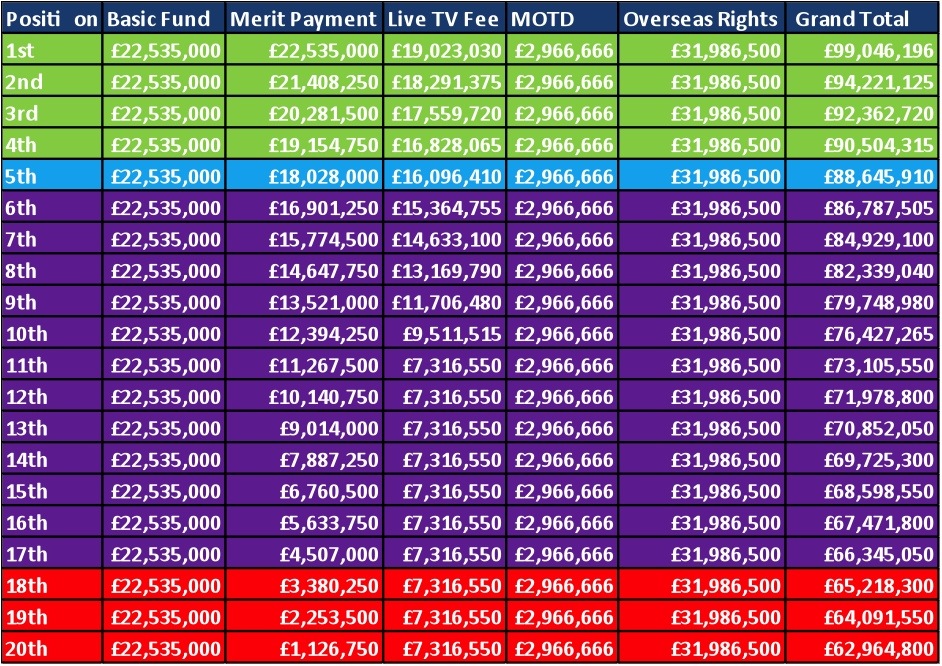
The Premier League winner of the FA Cup will accrue £3,397,500 in prize money.
The Merit Payment awards each Premier League position £1,126,750 more than the one below it.
Winning the FA Cup is the financial equivalent of finishing 3 positions higher in the Premier League based on the Merit Payment alone.
Newcastle United currently sit 6th in the Premier League having accumulated 23 points from their first 13 games.
How does this compare to previous seasons?

Top 5 starts after 13 games of the season:

An earlier piece about why Newcastle should stop playing after 13 games of the season.
Newcastle United In December Since 1995/96:

Following the international break, Newcastle United return to action with 2 home fixtures against Norwich and West Brom.
How well are Newcastle doing in comparison to other seasons? Below I look at how they will be positioned following the next 2 games.
In table A I have shown the points accumulated after 13 games, position in the league and how each season ranks against the others. 1st equals most points and 17th equals least amount of points after 13 games. I have also included the finishing position and points total for each season.
The average points after 13 games (19.4 pts) and average position (9th) are also included to show exactly how well Newcastle are doing this season.
I have started from the 1995/96 season as this is when the 20 team league first began.

Table A
In table B I have listed the possible outcomes from the next 2 games and where this would rank the 2013/14 season when up against each season since 1995/96.

Table B
If Newcastle win their next 2 games it will rank the current season 5th best for the first 13 games. The last time they had 23 points after 13 games it was good enough to place them 3rd in the league. They went on to finish the season in 4th.
Sunday sees Newcastle United take on Sunderland AFC in the first derby of the season. A lot is written on how the two teams compare, but how do the cities compare:

Newcastle United currently sit 16th in the Premier League having accumulated 7 points from their first 6 games.
How does this compare to previous seasons?
|
6 Games |
38 Games |
||||
|
Points |
Position |
Points |
Position |
||
|
95/96 |
15 |
1 |
78 |
2 |
|
|
96/97 |
12 |
3 |
68 |
2 |
|
|
97/98 |
12 |
10 |
44 |
13 |
|
|
98/99 |
8 |
9 |
46 |
13 |
|
|
99/00 |
1 |
19 |
52 |
11 |
|
|
00/01 |
10 |
6 |
51 |
11 |
|
|
01/02 |
11 |
5 |
71 |
4 |
|
|
02/03 |
7 |
13 |
69 |
3 |
|
|
03/04 |
3 |
19 |
56 |
5 |
|
|
04/05 |
8 |
8 |
44 |
14 |
|
|
05/06 |
5 |
14 |
58 |
7 |
|
|
06/07 |
7 |
12 |
43 |
13 |
|
|
07/08 |
11 |
5 |
43 |
12 |
|
|
08/09 |
4 |
19 |
34 |
18 |
|
|
10/11 |
7 |
10 |
46 |
12 |
|
|
11/12 |
12 |
4 |
65 |
5 |
|
|
12/13 |
9 |
9 |
41 |
16 |
|
|
13/14 |
7 |
16 |
? |
? |
|
|
Average |
8.3 |
10.1 |
53.5 |
9.5 |
|
Cells highlighted blue = 7 points after 6 games.
The average total of points after 6 games is 8.
The average position after 6 games is 10th.
During the 2002/03 season Newcastle had 7 points after 6 games and were positioned 13th in the league. They went on to finish 3rd. This is not likely to happen this season but it does show dramatic improvement can occur.
The cell highlighted red is Newcastle’s worst start to a season since the Premier League became a 20 team format.
The following 3 tables show the form of Newcastle United from their previous 8, 12 and 16 games.
8 Games:

12 Games:
16 Games:

Tables – http://weekendfootball.co.uk/
2013/14 season update.
How often do Newcastle score 3 or more goals in Premier League games?
The table below shows how many times Newcastle scored 3, 4 or 5+ goals in a game since the 2001/02 season.
Average = how many times each event usually occurs within a season.
| Season | 3 Goals | 4 Goals | 5+ Goals | League Position |
| 01/02 | 11 | 4 | 1 | 4 |
| 02/03 | 3 | 1 | 1 | 3 |
| 03/04 | 7 | 2 | 5 | |
| 04/05 | 3 | 1 | 14 | |
| 05/06 | 7 | 2 | 7 | |
| 06/07 | 5 | 13 | ||
| 07/08 | 5 | 1 | 12 | |
| 08/09 | 3 | 18 | ||
| 10/11 | 2 | 2 | 3 | 12 |
| 11/12 | 5 | 5 | ||
| 12/13 | 4 | 1 | 16 | |
| 13/14 | 12 | |||
| Average | 5.0 | 1.3 | 0.5 |
Based on the above table we can see on average Newcastle score:
3 goals in a game 5 times during the course of a season.
4 goals in a game once per season.
5+ goals in a game has only occurred 5 times since 2001/02…
View original post 45 more words
Why Newcastle United Should Stop Playing After 13 Games
Newcastle United have a reputation for being unpredictable. Recent seasons have shown the highs (5th place finish) and lows (16th place finish) of following the team. But do Newcastle have any consistent trends which can be shown over a number of seasons? I have chosen to look at each season since 1995/96.
Why from 1995/96? The 1995/96 season was the first time the Premier League consisted of 20 teams and each team played 38 games. When analysing the statistics from each season a number of trends began to appear. Newcastle United have a reputation for being inconsistent. Are they as inconsistent as we are made to believe?
I considered the following areas:
1. Win/Draw/Lose %
2. Goals Scored/Conceded
3. League Position Comparison After 13, 26 and 38 Games
I will take each in turn and highlight the trends developing in each area.
1. Win/Draw/Lose %
Taking the 608 games Newcastle United have played since the start of the 1995/96 season I have broken these down into each month they were played as shown in Figure A.
|
P |
W |
D |
L |
F |
A |
|
|
Aug |
50 |
16 |
14 |
20 |
64 |
71 |
|
Sept |
60 |
30 |
8 |
22 |
93 |
68 |
|
Oct |
58 |
29 |
11 |
18 |
100 |
79 |
|
Nov |
61 |
21 |
22 |
18 |
75 |
82 |
|
Dec |
89 |
30 |
22 |
37 |
128 |
134 |
|
Jan |
57 |
25 |
16 |
16 |
88 |
74 |
|
Feb |
54 |
24 |
18 |
12 |
79 |
66 |
|
Mar |
56 |
16 |
11 |
29 |
66 |
77 |
|
Apr |
78 |
31 |
26 |
21 |
107 |
86 |
|
May |
45 |
11 |
18 |
16 |
52 |
61 |
Fig. A
The data from this table produces a graph displaying Wins, Draws and Losses that is initially hard to interpret with its peaks and troughs. To make the data slightly easier to read I also broke each area down as a percentage, as shown in Figure B.
|
Month |
W % |
D % |
L % |
|
Aug |
32 |
28 |
40 |
|
Sept |
50 |
13.3 |
36.7 |
|
Oct |
50 |
19 |
31 |
|
Nov |
34.4 |
36.1 |
29.5 |
|
Dec |
33.7 |
24.7 |
41.6 |
|
Jan |
43.9 |
28.1 |
28.1 |
|
Feb |
44.4 |
33.3 |
22.3 |
|
Mar |
28.6 |
19.6 |
51.8 |
|
Apr |
39.7 |
33.3 |
27 |
|
May |
24.4 |
40 |
35.6 |
Fig. B
Newcastle win most games in September and October and win the least amount of games in May.
Newcastle draw the most games in November and the least amount of games in September.
Newcastle lose the most games in March and the least amount of games in February.
Using the data from the table above to create Figure C, and inserting a trend line for each area, we can see:
Wins steadily decline. Draws increase. Defeats remain relatively consistent.

Fig. C
Due to the wins declining and defeats remaining consistent this has a direct effect on league position, which is discussed further on.
I have then grouped the Wins, Draws and Defeats into sections. I chose to break the football calendar into ‘August to October’, ‘November to February’ and ‘March to May’. I am aware the middle section features the most games, but to counter this I used the percentage of each area to provide a fair view. The results can be seen in Figure D below.
|
Played |
W % |
D % |
L % |
Goals Scored per game |
Goals Conceded per game |
|
|
Aug-Oct |
168 |
44.6 |
19.6 |
35.7 |
1.5 |
1.3 |
|
Nov-Feb |
261 |
38.3 |
29.9 |
31.8 |
1.4 |
1.4 |
|
Mar-May |
179 |
32.4 |
30.7 |
36.9 |
1.3 |
1.3 |
Fig. D
Taking this data and inserting it into a graph produces the following (Figure E):

Fig. E
This graph produces a much clearer view of how each area (Win, Draw, and Loss) performs over the course of a season:
Wins decline 12.2%.
Draws gain 12.8%
Losses gain 1.2%
The ‘Win’ line is in a very constant decline, dropping 6.3% from the first 3 months to the second group and then dropping a further 5.9% from the second section to the end of the season.
2. Goals Scored/Conceded
Taking the data from Figure A, I looked at how many goals Newcastle United scored/conceded per game:
|
Month |
Goals Scored per game |
Goals Conceded per game |
|
Aug |
1.3 |
1.4 |
|
Sept |
1.6 |
1.1 |
|
Oct |
1.7 |
1.4 |
|
Nov |
1.2 |
1.3 |
|
Dec |
1.4 |
1.5 |
|
Jan |
1.5 |
1.3 |
|
Feb |
1.5 |
1.2 |
|
Mar |
1.2 |
1.4 |
|
Apr |
1.4 |
1.1 |
|
May |
1.2 |
1.4 |
Fig. F
Over the 608 games Newcastle have scored on average 1.4 goals per game and conceded 1.3 goals per game.
I then broke this down further into the 3 sections mentioned above in section 1:
|
Played |
Goals Scored per game |
Goals Conceded per game |
|
|
Aug-Oct |
168 |
1.5 |
1.3 |
|
Nov-Feb |
261 |
1.4 |
1.4 |
|
Mar-May |
179 |
1.3 |
1.3 |
Fig. G
Inserting this data into a chart it shows us:
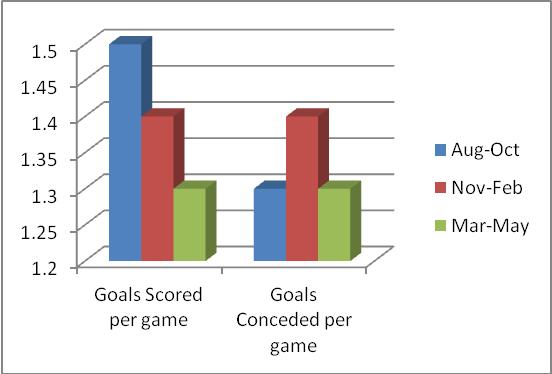
Fig. H
Goals Scored produces a clear declining trend through the course of the season with games in March-May seeing Newcastle score 0.2 goals less per game. This may not seem like a big difference but it can be linked to the fact that Newcastle win fewer games in March-May, which in turn leads to a lower league finishing position, as discussed below.
3. League Position After 13, 26 and 38 Games
I have noted the league position of Newcastle after 13, 26 and 38 games so each season could be split into thirds, or as near as dammit to thirds (Note: this does not represent the 3 monthly splits I have shown in sections 1 and 2).
The results are shown in Figure I below:
|
Position Difference |
||||||
|
13 Games |
26 Games |
38 Games |
13 – 38 |
26 – 38 |
||
|
95/96 |
1 |
1 |
2 |
-1 |
-1 |
|
|
96/97 |
1 |
3 |
2 |
-1 |
1 |
|
|
97/98 |
7 |
10 |
13 |
-6 |
-3 |
|
|
98/99 |
13 |
11 |
13 |
0 |
-2 |
|
|
99/00 |
17 |
15 |
11 |
6 |
4 |
|
|
00/01 |
7 |
10 |
11 |
-4 |
-1 |
|
|
01/02 |
3 |
2 |
4 |
-1 |
-2 |
|
|
02/03 |
6 |
3 |
3 |
3 |
0 |
|
|
03/04 |
6 |
4 |
5 |
1 |
-1 |
|
|
04/05 |
10 |
12 |
14 |
-4 |
-2 |
|
|
05/06 |
12 |
13 |
7 |
5 |
6 |
|
|
06/07 |
17 |
10 |
13 |
4 |
-3 |
|
|
07/08 |
11 |
13 |
12 |
-1 |
1 |
|
|
08/09 |
17 |
13 |
18 |
-1 |
-5 |
|
|
10/11 |
7 |
10 |
12 |
-5 |
-2 |
|
|
11/12 |
4 |
6 |
5 |
-1 |
1 |
|
|
12/13 |
14 |
16 |
16 |
-2 |
0 |
|
|
Average |
9.0 |
8.9 |
9.5 |
-0.47 |
-0.53 |
|
Fig. I
Over the last 17 seasons, the league position after 38 games compared to the position after 13 games is lower on 11 occasions, and compared to 26 games is lower on 10 occasions:

Fig. J
If we consider the 5 most recent seasons:
– The position after 38 games only changes on average by -2 positions compared to the position following the first 13 games.
– The position after 38 games compared to 26 games changes by only -1 on average.
Both of the above shown in Figure K:

Fig. K
Newcastle have been in the top 6 after the first 13 games of the season 6 times (35%) since 1995/96. Whenever they have been in this position after 13 games they have never finished lower than 5th. During the 2011/12 season the media and many fans expected Newcastle to fall away from the top 6 after their strong start, but following the trend of the 5 previous seasons where they were in the top 6 after the first 13 games they remained high up in the league and finished 5th.

Fig L.
On average Newcastle United’s finishing position varies by only -0.47 places when compared to their position after 13 games and -0.53 compared to the position after 26 games.
The average decline in finishing position can be linked to the fact Newcastle score fewer goals and win fewer games during March-May compared to August-October.
So What Does It All Mean?
Well, Newcastle United should stop playing after 13 games!
The first 13 games take place during the strongest months for ‘Wins’ and ‘Goals Scored’. Their position in the Premier League declines over the course of the season, not significantly, but it is still a decline. The season ending after 13 games would leave Newcastle in their strongest position.
If Newcastle were to be placed in the top 6 after 13 games, we would hope they followed the previous trend of never finishing the season lower than 5th.
And finally, Newcastle United are a top 10 team with an average finishing position of 9.5!
